
Electronic Structure Bugs in CRYSTALClear
CRYSTALClear
3
Posts
2
Posters
460
Views
2
Watching
-
import CRYSTALClear.plot as CCplt
import matplotlib.pyplot as plt
from pathlib import Path

band_files = list(Path('.').rglob('BAND.DAT'))

bands = []

for index, band_file in enumerate(band_files):
    print(f'Processing: {band_file}')
    band = Properties_output().read_electron_band(str(band_file))
    bands.append(band)

    CCplt.plot_electron_band(
        band,
        energy_range=[-0.7, 16],
        linewidth=1.5,
        figsize=(8,6),
        k_labels=['Gamma','W','X','L','Gamma']
    )
    plt.show()


CCplt.plot_electron_band(
    bands,
    energy_range=[-1, 16],
    linewidth=1.5,
    figsize=(9,7),
    k_labels=['Gamma','W','X','L','Gamma']
)
plt.show()

END_OF_PYTHON
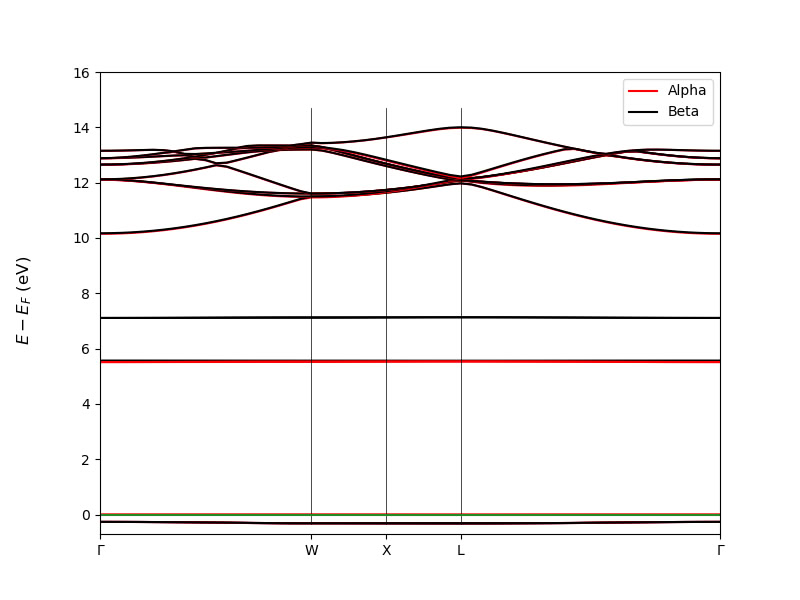
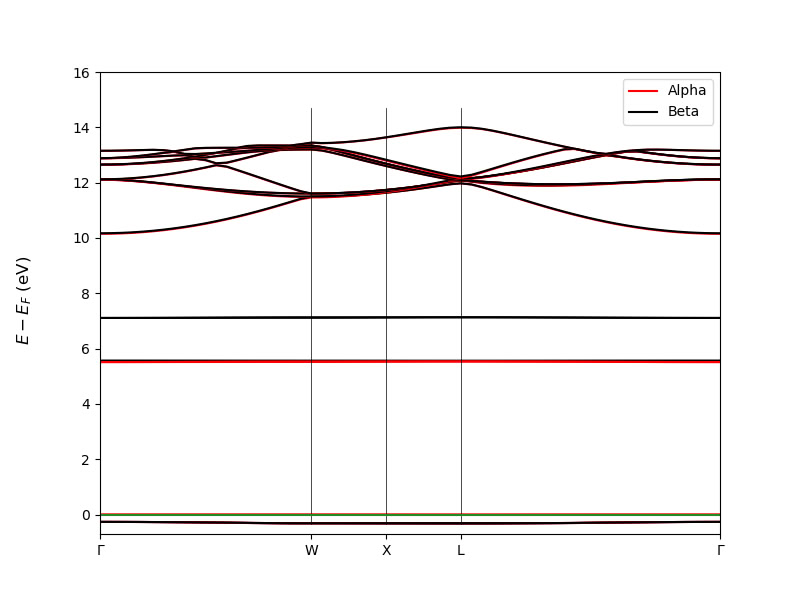
I cannot change the height of the lines marking the k-points on the band structure diagram.
#!/bin/bash

source /home/noctua-v2/miniconda3/bin/activate crystal
exec python - "$@" <<'END_OF_PYTHON'

from CRYSTALClear.crystal_io import Properties_output
import CRYSTALClear.plot as CCplt
import matplotlib.pyplot as plt


# DOSS.DAT path declaration
doss = 'DOSS.DAT'

# Crystal Object generation
doss = Properties_output().read_electron_dos(doss)

# Plot generation
CCplt.plot_electron_dos(doss, overlap=True, color=['mediumvioletred', 'yellow', 'indigo', 'red'], labels=['F$', 'Si$','Rb$', 'Total'], dos_range=[0,10])

plt.show()
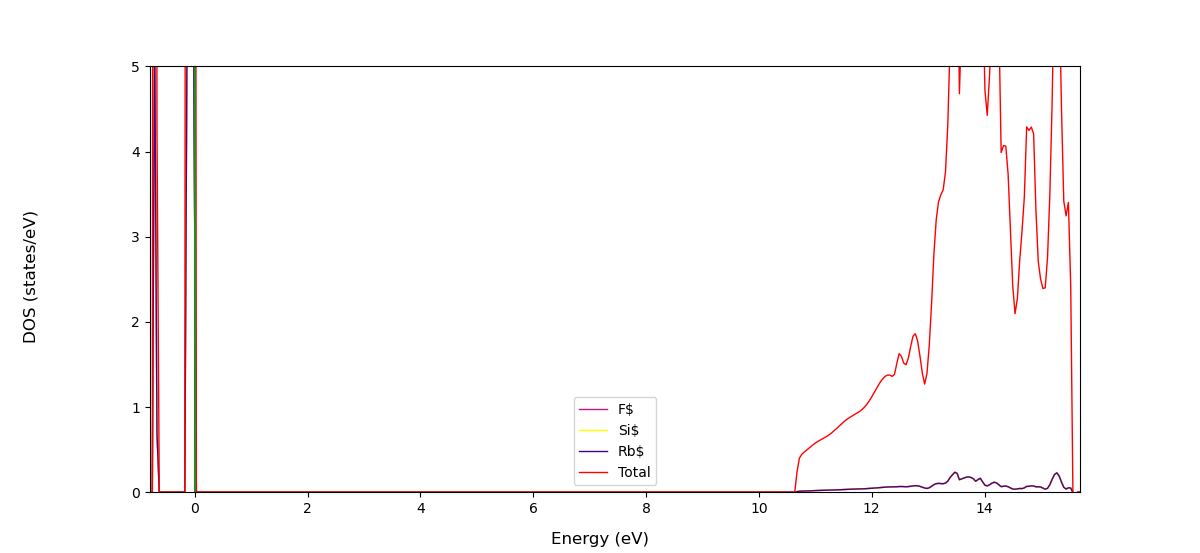
I cannot change the y-axis grid on the DOS plot.

Hello! It looks like you're interested in this conversation, but you don't have an account yet.
Getting fed up of having to scroll through the same posts each visit? When you register for an account, you'll always come back to exactly where you were before, and choose to be notified of new replies (either via email, or push notification). You'll also be able to save bookmarks and upvote posts to show your appreciation to other community members.
With your input, this post could be even better 💗
Register Login