Phonon density of states plotting
-
Hello CRYSTAL team,
I recently calculated phonon band structures and phonon density of states (PDOS) for a material.
From the output, it seems that the phonon DOS was calculated three times. It is printed in the output once every time a new band path was calculated. In my case, I followed the Gamma-X-Y-Gamma path so it prints PDOS once after Gamma-X, once after X-Y, once after Y-Gamma.
I plotted all of these instances independently (including their atomic projections) using a python script, and they all look different. However, when using CRYSPLOT, it only shows the last calculated PDOS instance as the total PDOS.(see attached figure)
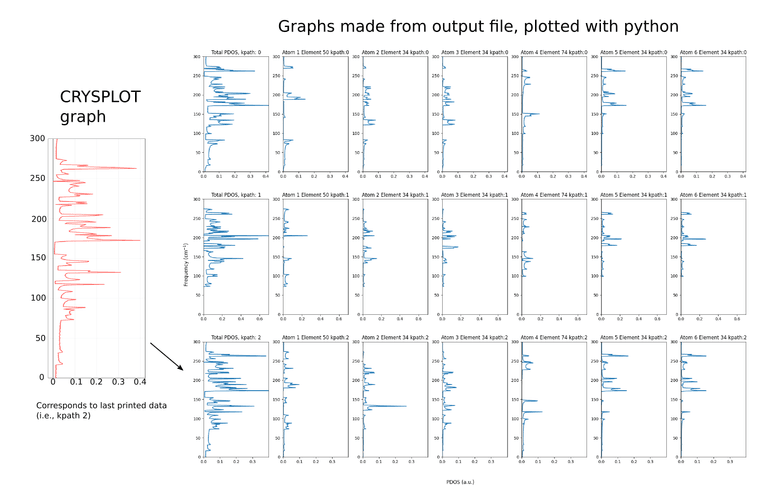
I was wondering if the other two calculated total PDOS are ignored, and how the total PDOS is calculated such that only the last instance is shown. I was hoping to get a better understanding on how the output is organized for future plots.
Thank you,
Danny -
Hi,
As there are different ways to compute phonons in CRYSTAL, can you share your input and output files to better understand what is computed and printed?
-
Hello Prof. Erba,
Of course, here is the input/output:
https://drive.google.com/drive/folders/1qTMFzImOYX69U-E4trT06_WFn90JjcPZ?usp=drive_linkBest,
Danny -
Hi Danny,
From a first look at your input file, I noticed that you are performing a combined PDOS and BANDS calculation. This has not been fully tested as we prefer to run two separate jobs, one for PDOS and one for BANDS. Once the harmonic frequencies are computed, they can both be run through restarts and are both very fast.
Indeed, the PDOS calculation produces a single set of data if run without the BANDS keyword.
I therefore suggest to split your calculation in two different ones: one for PDOS and one for BANDS. You can use the RESTART keyword in the FREQCALC block to avoid recomputing the Hessian matrix (see page 219 of the User manual).
Let me know if this helps!
-
Hello Giacomo,
Thank you very much! I had also noticed that both PDOS and BANDS save consecutively to the f25, it makes sense that there might be some issues while writing.
Currently our HPC at MSU is down for maintenance, but I will run BANDS/PDOS separately through RESTART early next week and let you know how it goes.
Also, thanks for the link to the updated tutorial!
Best,
Danny -
Hello again,
I ran the separate phonon bands and DOS, as recommended. I noticed that the PDOS only shows particular crossings at the Gamma and M points when running them separately, as you can see by the guidelines in the figure below. With PDOS, I was hoping to get information about the entire phonon dispersion, rather than exclusively at these two high-symmetry points. Is there anything that can be done to sample more points in reciprocal space?
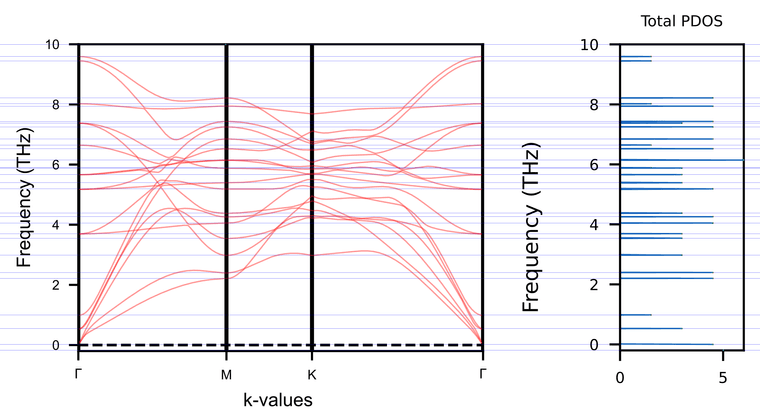
- Note that I set a different k-path for these calculations (Gamma-M-K-Gamma), since I made a mistake in my previous k-points regarding the system symmetry
Moreover, I analyzed the PDOS from a combined BAND/PDOS calculation again, and I noticed that it gives much more information. These plots seem to show the PDOS for every k-path that is set for bands as you can see from the horizontal lines I plotted, which show the areas with highest PDOS and their corresponding bands for each k-path.
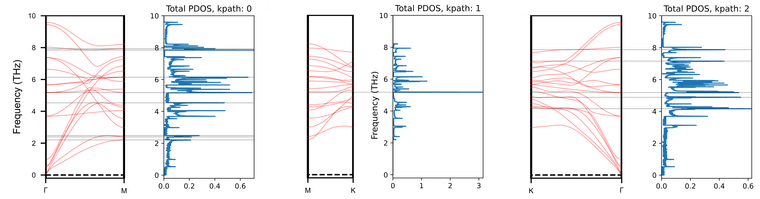
Is it safe to assume that this PDOS correctly corresponds to these paths, or should I be careful when using this method, since it has not been fully tested?
As additional information, I defined my frequency blocks as follows:
Bands only
FREQCALC
DISPERSION
RESTART
BANDS
6 1000
3
0 0  3 0
3 0  2 2
2 2  0 0
ENDFREQ
PDOS only
FREQCALC
DISPERSION
RESTART
PDOS
333 2000
1
ENDFREQ
Combined calculation
FREQCALC DISPERSION RESTART PDOS 333 2000 1 BANDS 6 1000 3 0 0 3 0 3 0 2 2 2 2 0 0 ENDFREQ -
Hi,
Let me try to rationalize what you observe as follows: In CRYSTAL, interatomic force constants for phonon dispersion are computed with a direct space approach within a supercell. Because of the reciprocity relation between direct and reciprocal lattices, the number of k-points for which phonons can be computed is determined by the expansion factor of the supercell relative to the primitive cell. For instance, with your 2x2 supercell expansion for a 2D system, you get to compute phonons at just 4 k-points. In order to get the phonons at more k-points you can do one of two things (or both):
- Increase the supercell expansion (i.e. increase the size of the supercell). Going to 3x3 gives you phonons at 9 k-points, 4x4 gives you phonons at 16 k-points, and so on. This is done through the SCELPHONO keyword:
SCELPHONO 6 0 0 6- Interpolate the interatomic force constants to evaluate the dynamical matrices at additional k-points with respect to those determined by the expansion matrix of the supercell. This can be done through the INTERPHESS option as follows:
INTERPHESS
8 8
0
NOTE 1: This interpolation is safe only if the interatomic force constants vanish within the supercell. This usually requires the supercell to have a radius of at least 10-15 Angstroms (i.e. the supercell has to be large).
NOTE 2: This interpolation is used when phonon bands are computed with BANDS. Thus, the starting supercell has to be large to compute phonon bands safely.
In your case, what you observe is the following: when you do the BANDS calculation you are doing the interpolation. When you do the PDOS calculation you are not. To add the interpolation in your PDOS calculation (and get a phonon density-of-states that matches that of the phonon band plot) you need to add the INTERPHESS option.
But, and this is an important but, in this way you would get matching results but they are likely to be both wrong because the supercell you are starting from is too small. To get more reliable results, you need to significantly increase the supercell expansion matrix.
Hope this helps,
-
Hello Dr. Erba,
Thank you very much for your thorough explanation! This clarifies all my questions. I will make sure to re-calculate using a larger supercell.
Best,
Danny