Skip to content
  • Home
  • Recent
Collapse
Brand Logo
CRYSTAL23
Latest v1.0.1
Tutorials Try the Demo Get a License
Tutorials Try the Demo Get a License Instagram
  1. Home
  2. Visualisation Tools
  3. CRYSTALClear
  4. Electronic Structure Bugs in CRYSTALClear

Electronic Structure Bugs in CRYSTALClear

Scheduled Pinned Locked Moved CRYSTALClear
3 Posts 2 Posters 38 Views
  • Oldest to Newest
  • Newest to Oldest
  • Most Votes
Log in to reply
This topic has been deleted. Only users with topic management privileges can see it.
  • QMQDCHEMundefined Offline
    QMQDCHEMundefined Offline
    QMQDCHEM
    wrote last edited by
    #1

    b51cde88-0bb3-4dd8-a7fc-29f23ae36e25-изображение.png

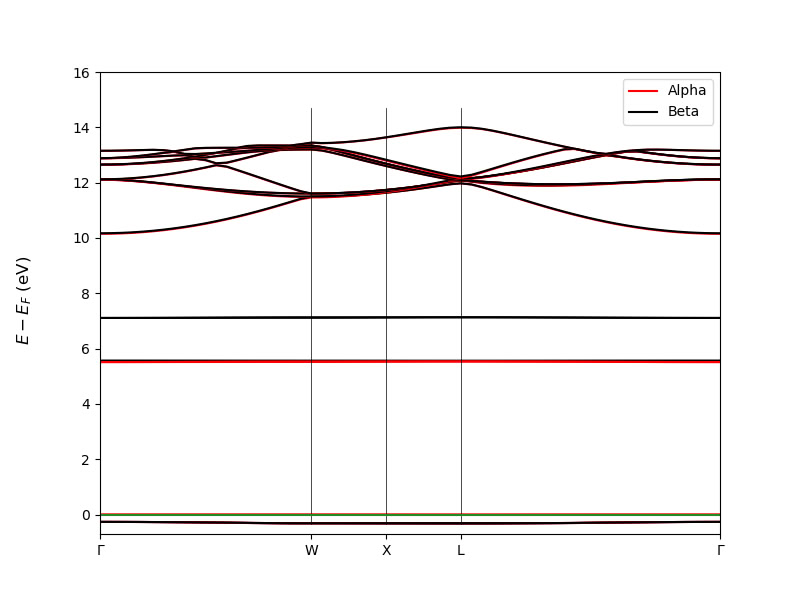
    import CRYSTALClear.plot as CCplt
    import matplotlib.pyplot as plt
    from pathlib import Path
    
    band_files = list(Path('.').rglob('BAND.DAT'))
    
    bands = []
    
    for index, band_file in enumerate(band_files):
        print(f'Processing: {band_file}')
        band = Properties_output().read_electron_band(str(band_file))
        bands.append(band)
        
        CCplt.plot_electron_band(
            band, 
            energy_range=[-0.7, 16], 
            linewidth=1.5, 
            figsize=(8,6), 
            k_labels=['Gamma','W','X','L','Gamma']
        )
        plt.show()
    
    
    CCplt.plot_electron_band(
        bands, 
        energy_range=[-1, 16], 
        linewidth=1.5, 
        figsize=(9,7), 
        k_labels=['Gamma','W','X','L','Gamma']
    )
    plt.show()
    
    END_OF_PYTHON
    

    I cannot change the height of the lines marking the k-points on the band structure diagram.

    Figure_1.png

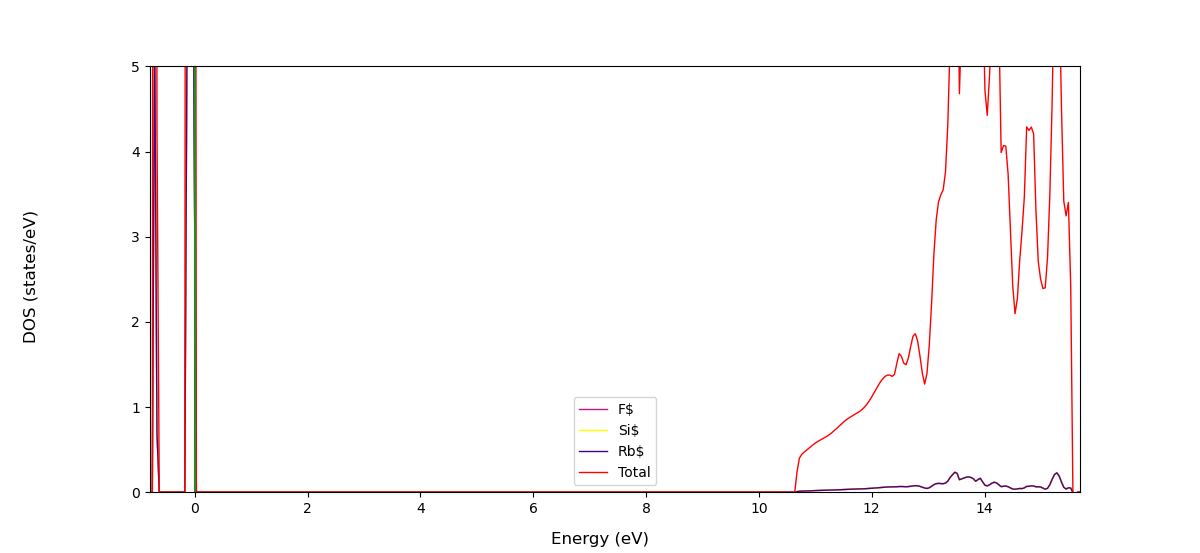
    #!/bin/bash
    
    source /home/noctua-v2/miniconda3/bin/activate crystal
    exec python - "$@" <<'END_OF_PYTHON'
    
    from CRYSTALClear.crystal_io import Properties_output
    import CRYSTALClear.plot as CCplt
    import matplotlib.pyplot as plt
    
    
    # DOSS.DAT path declaration
    doss = 'DOSS.DAT'
    
    # Crystal Object generation
    doss = Properties_output().read_electron_dos(doss)
    
    # Plot generation
    CCplt.plot_electron_dos(doss, overlap=True, color=['mediumvioletred', 'yellow', 'indigo', 'red'], labels=['F$', 'Si$','Rb$', 'Total'], dos_range=[0,10])
    
    plt.show()
    

    I cannot change the y-axis grid on the DOS plot.

    1 Reply Last reply
    0
    • QMQDCHEMundefined Offline
      QMQDCHEMundefined Offline
      QMQDCHEM
      wrote last edited by
      #2

      It was my mistake with DOSS. With doss is ok.

      1 Reply Last reply
      0
      • fbodoundefined Offline
        fbodoundefined Offline
        fbodo
        wrote last edited by
        #3

        Hi QMQDCHEM ,
        Could you share your BAND.DAT file so that I can do some quick test?
        Thanks

        Filippo Bodo
        PhD Candidate
        Department of Chemistry, Southern Methodist University, Dallas , TX, USA
        Dipartimento di Chimica, Università degli Studi di Torino, Torino, Italy
        https://github.com/Filo3dg

        1 Reply Last reply
        0

        Powered by Crystal Solutions
        • Login

        • Don't have an account? Register

        • Login or register to search.
        • First post
          Last post
        0
        • Home
        • Recent