phonon dispersion in thermo
-
Dear all, what is the purpose of the phonon dispersion calculations according to the tutorial? What is the effect we are seeing, going beyond the gamma point?
https://tutorials.crystalsolutions.eu/tutorial.html?td=thermo&tf=thermo2#phonon
More importantly, how do I set it up properly? What size SCELPHONO should I be after? Is the point to have all of my crystals about the same atoms in the generated SCELPHONO for appropriate comparison? I was perusing the tutorial but I could not quite understand the purpose or the correct setup of SCELPHONO
thank you
Jonas
-
Hi Jonas,
When computing thermodynamic properties, we should set up a canonical partition function over all vibrational states of the lattice, which includes phonons at all k points within the first Brillouin zone in principle. The partition function, and thus thermodynamic properties, tend to converge as the sampling of phonons at different k points improves.
As an example, consider what happens for the specific heat and vibrational entropy of MgO in the picture below, where lines of increasing thickness correspond to calculations on larger supercells (i.e. to richer k sampling):
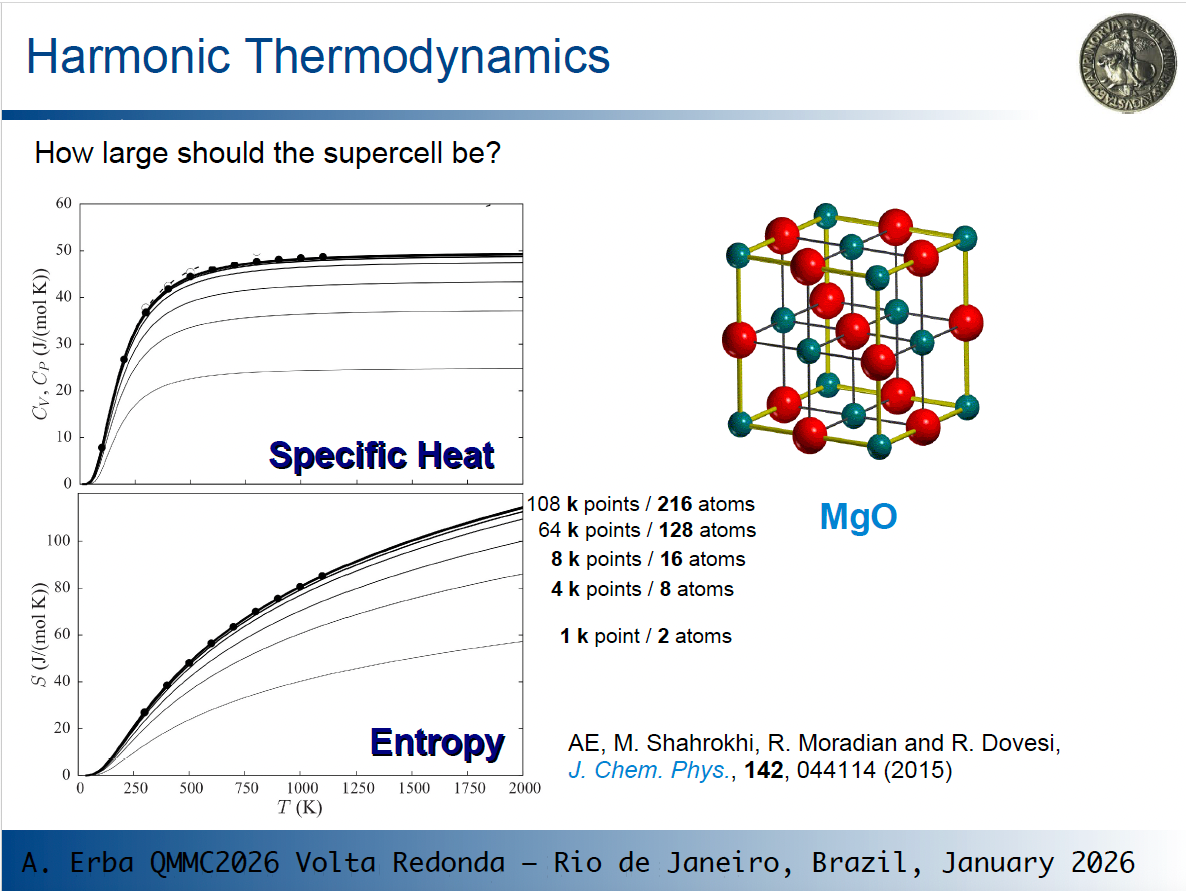
As you see, thermodynamic values change and eventually converge!
So, depending on the size of the original cell, phonon dispersion can have a very large effect on computed thermodynamic properties. This is particularly evident for MgO where the original cell is very small.
So, going back to one of your questions: "how large should the supercell be?" You should use the smallest cell that allows you to get converged results. How to determine it? By progressively increasing the size and by checking your results.
The rule of thumb you suggest of using supercells for different systems containing a similar number of atoms is a good guideline for consistent expansions across different systems.
Hope this helps,
-
it helps, thank you. I just do not see entropy (ever) converging in your slide...
-
Hi Jonas,
that depends a bit on what you mean by "not converging". Here the discussion is about converging the quantities of interest with respect to the underlying computational parameters, in this case k-point sampling and simulation cell size. You can see that the lines eventually get "crammed up" as the number of k-points and supercell size increase.
At the bottom of the S vs. T graph it starts with 1 k-point and 2 atoms with the obtained curve having a certain profile. When the simulation contains 4 k-points and 8 atoms, the obtained curve is quite far off from the first one, to put it simple, or not yet converged. With further increase of k-points and number of atoms in the supercell, this discrepancy diminishes and one gets very close to the black dots (which I presume are experimental values of high-quality reference calculations).
If by "not converged" you refer to the fact that the profile of the entropy is not plateaued at high temperatures, that is a whole other discussion")
Hope this helps,
Cheers,
Aleks -
Yes Aleks that's what I meant. But I see now convergence with k points thank you
