
Query regarding COHP Calculation
-

Hello,
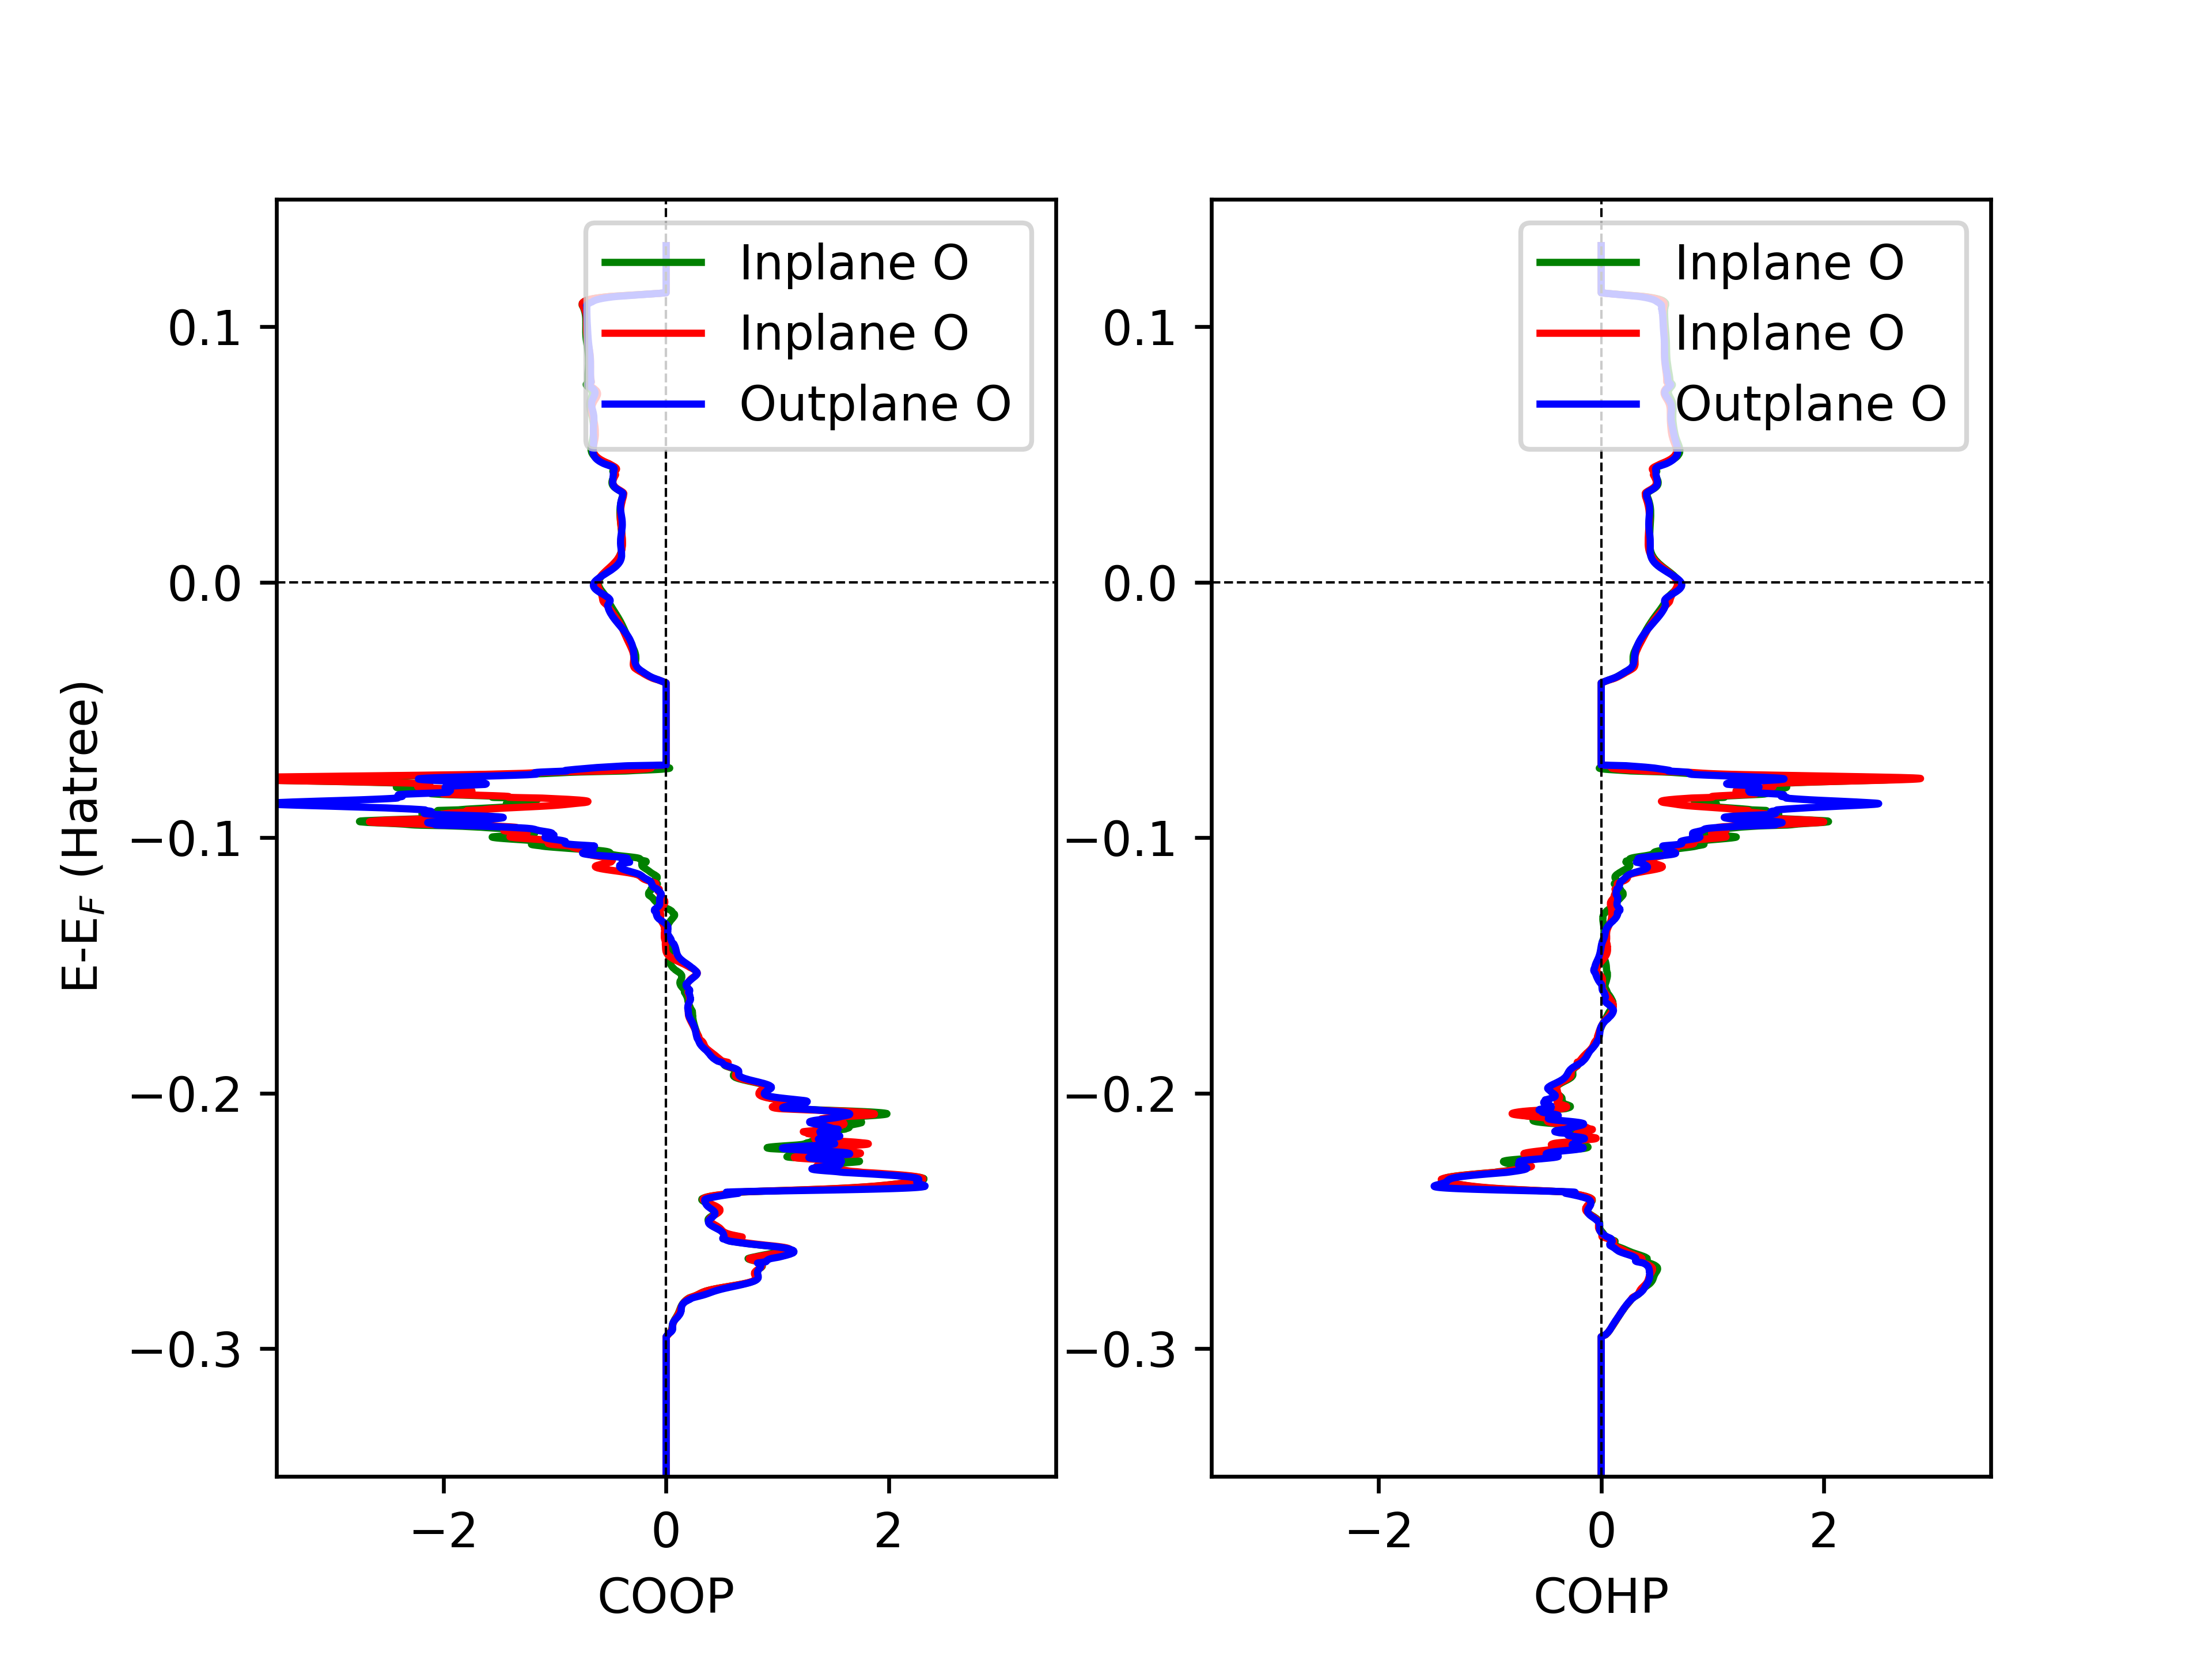
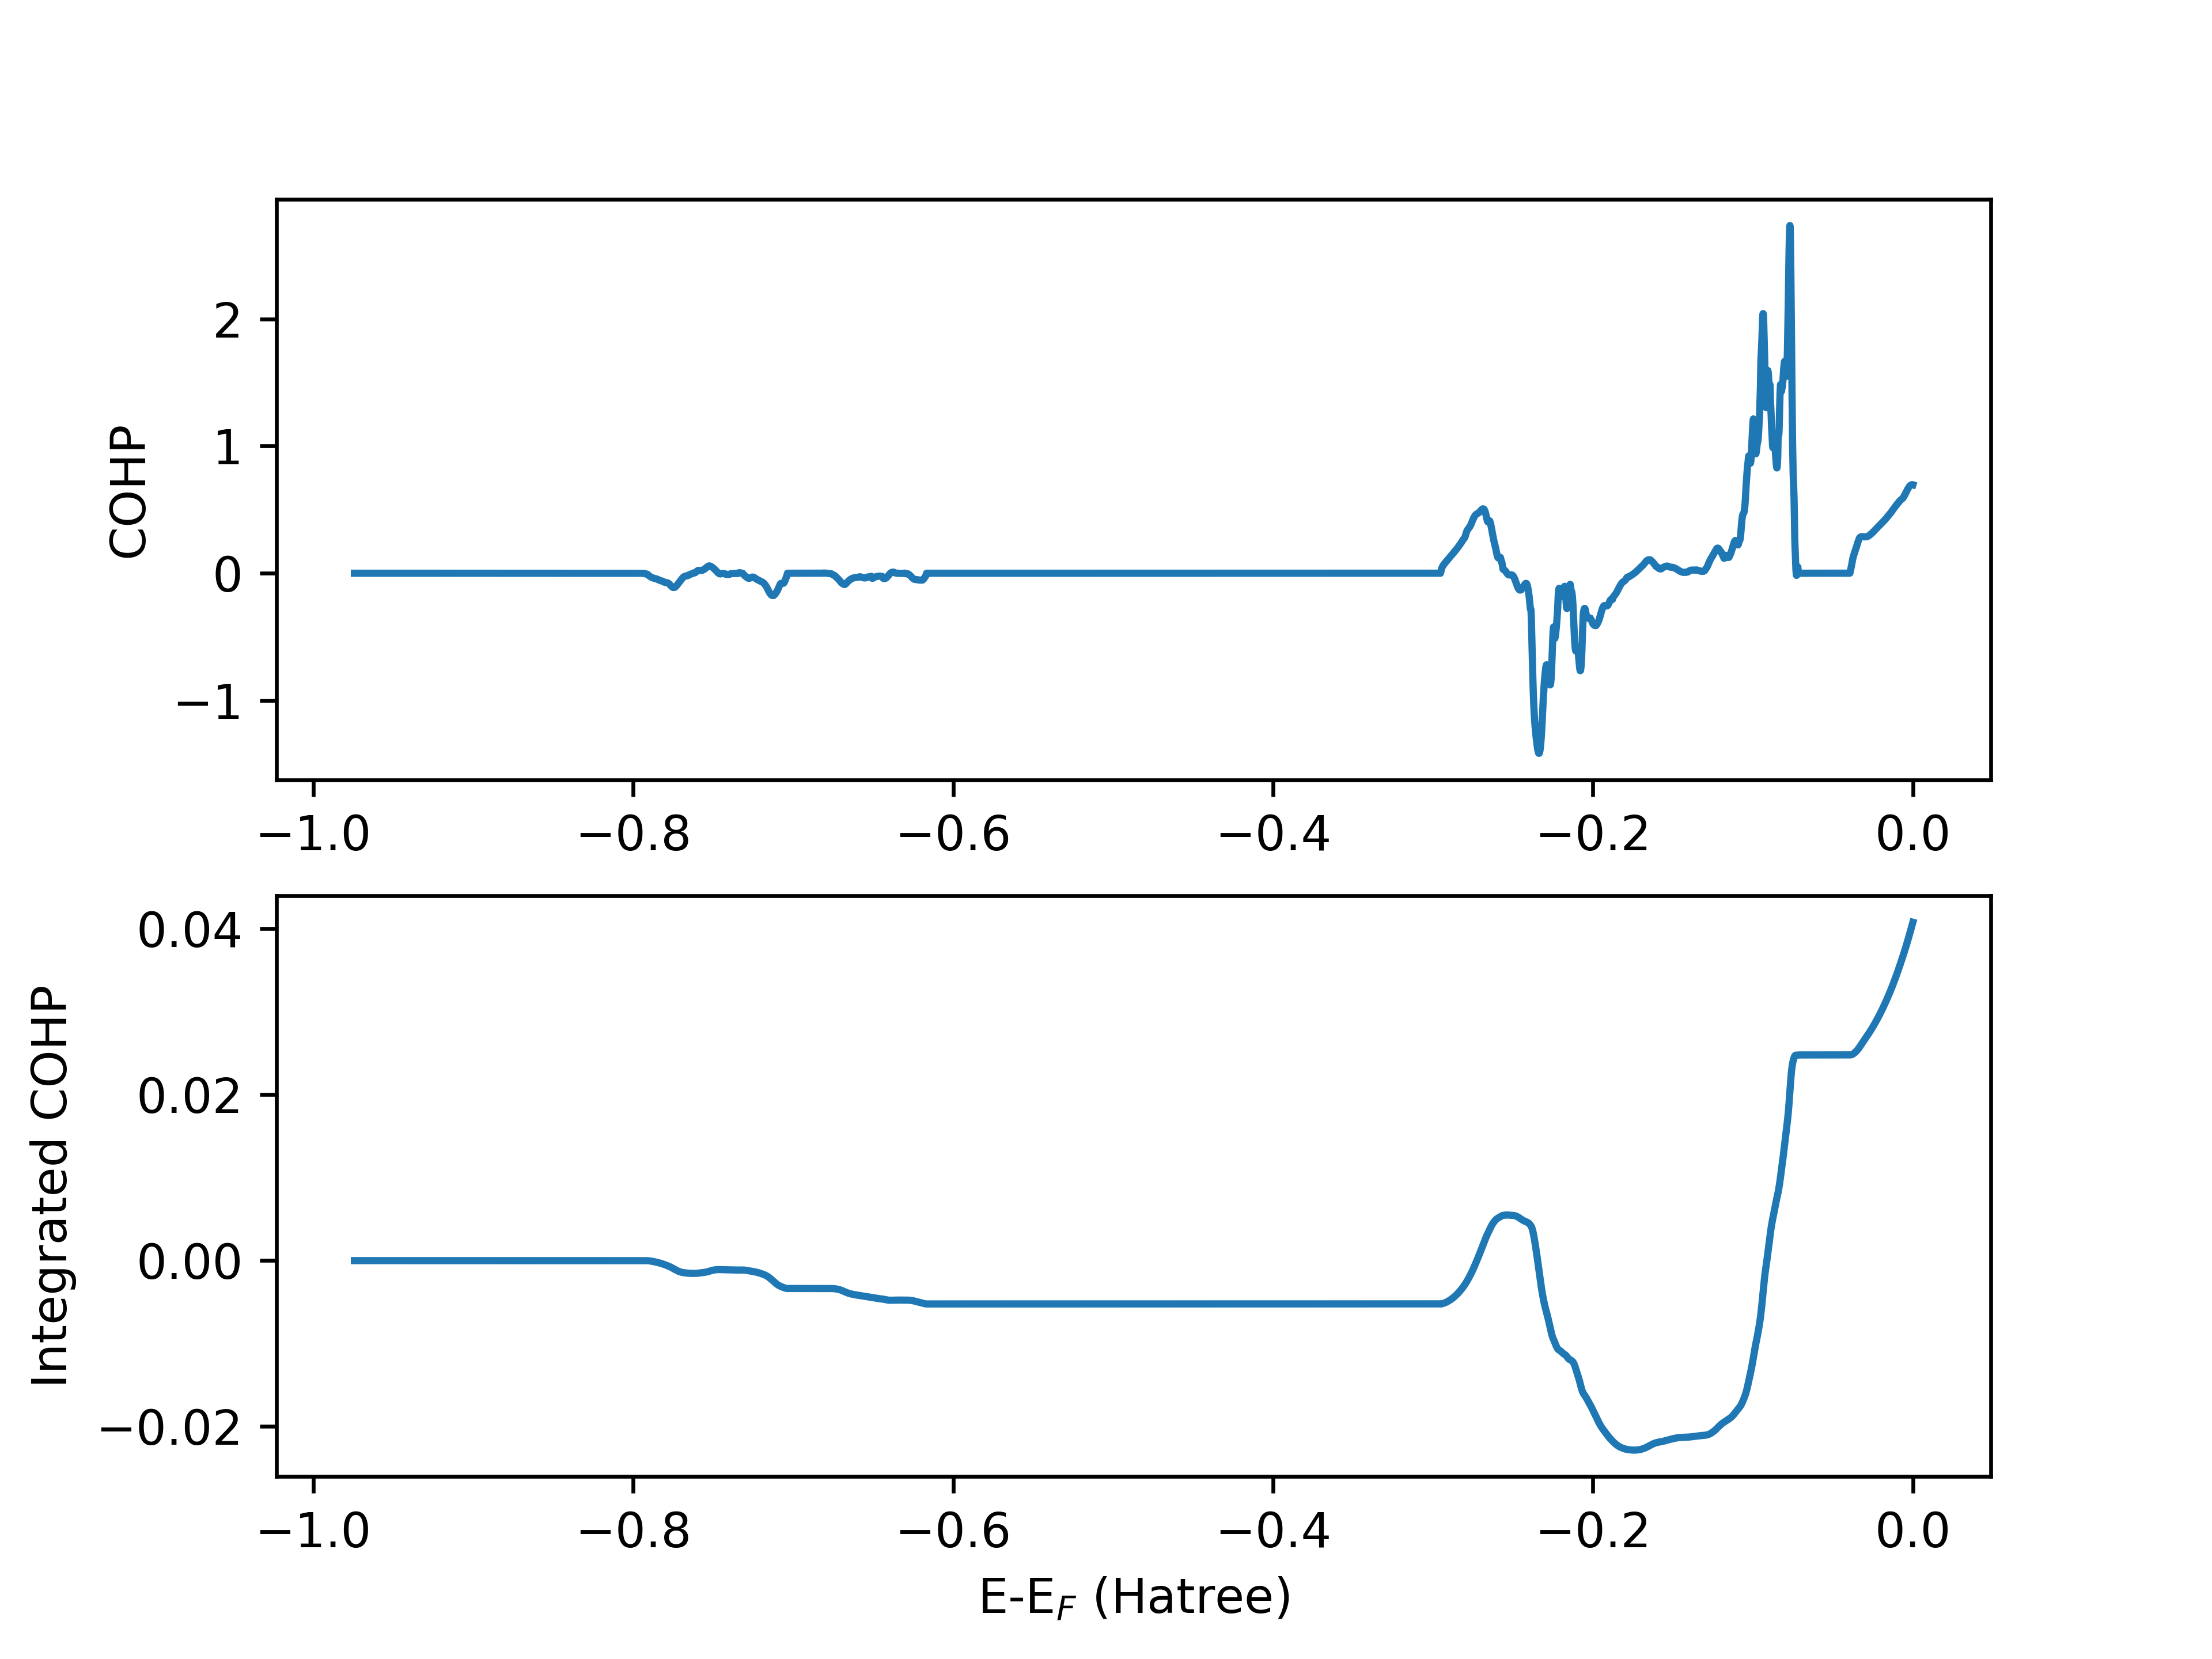
I am studying a particular Perovskite structure. I performed COHP calculation to understand the bond strength. As per the paper mentioned in the manual (PCCP,17,31023-31029 (2015) -"Integration of the COHP diagram is a measure of bond strength (in units of energy)).
But when I perform the COHP analysis and integrated till Fermi level, I am getting a positive value for the integrated COHP, that means the bond is unstable right ?, which is not possible since it is a very well experimentally observed structure. Attached below are the COHP and integrated COHP plot between oxygen and Ni atom within the considered unit cell.
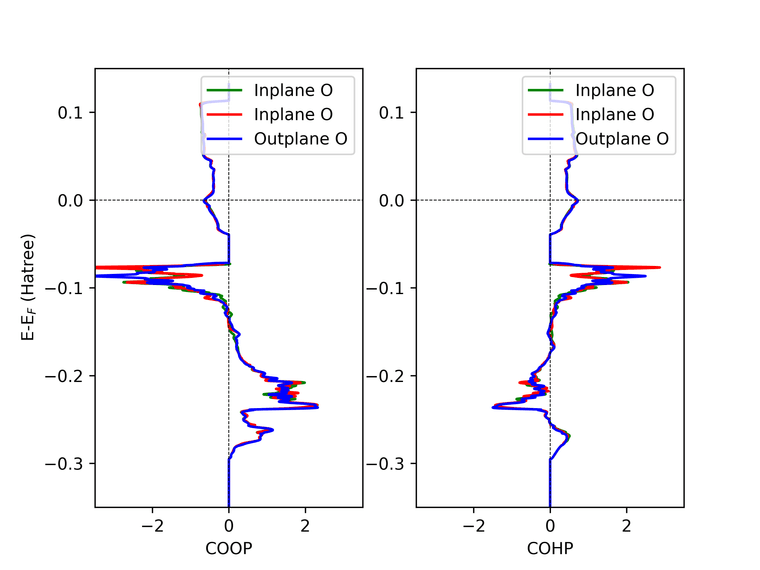
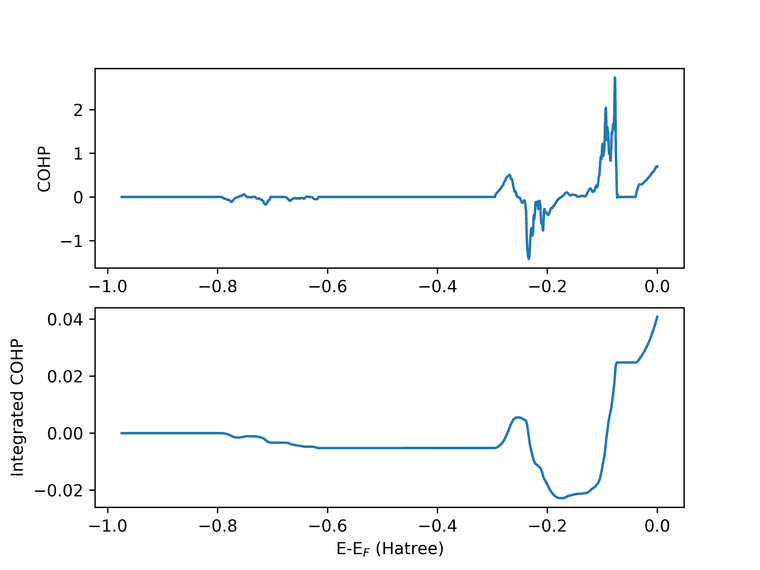
Any suggestions ? I am attaching the input and COHP files from properties calculation.
Thanks in advance for your help !
Regards,
Rams -
Hi Prof. Erba,
Thanks for the reply. From the file, I could see there are value from energy " -7.9324E-01" (Line No: 81826). I could plot the data using Python, Xmgrace. With CRYSPLOT somehow the data loading is slow and my browser hangs so I am not able to check it. But definitely there is data.
I requested for COHP between Ni and three nearby oxygen. In the file there are 5 columns, so if I am not mistaken it corresponds to "Energy - Next three columns in the order I request - Final Column of DOS ?" (Because the last column data when plotted matches the DOS)
Thanks & Regards,
Rams

Hello! It looks like you're interested in this conversation, but you don't have an account yet.
Getting fed up of having to scroll through the same posts each visit? When you register for an account, you'll always come back to exactly where you were before, and choose to be notified of new replies (either via email, or push notification). You'll also be able to save bookmarks and upvote posts to show your appreciation to other community members.
With your input, this post could be even better 💗
Register Login