Skip to content

World

Topics from outside of this forum. Views and opinions represented here may not reflect those of this forum and its members.

A world of content at your fingertips…

Think of this as your global discovery feed. It brings together interesting discussions from across the web and other communities, all in one place.

While you can browse what's trending now, the best way to use this feed is to make it your own. By creating an account, you can follow specific creators and topics to filter out the noise and see only what matters to you.

Ready to dive in? Create an account to start following others, get notified when people reply to you, and save your favorite finds.

Register Login
  • CaesarSalad

    Hello.

    If I want to run a calculation with ATOMSPIN 1 for an ion that has no unpaired electrons in its valence orbitals (as defined in its basis set), should I define a new basis set for it ?

    For example, I have a basis set for Oxygen 2- that is closed shell, and I'd like to force crystal to see it as O1- from the very beginning.

    Should I write a new basis set for it or can I simply just use ATOMSPIN with the same basis set as for O2-?

    Thanks a lot!

    Chris


    Hi Aleks, that's very helpful, thank you! I'll try that on my cells, cheers, C.
  • denkos

    Hi!
    I want to calculate the electric field gradient using POTC keyword (with CRYSTAL14) and am confused about the output. From the convention, the EFG components value should follow |CC|>|BB|>|AA|, which is not the case here. So my question is, can I consider the coordinate system to have an issue and just sort the output values to fulfill the convention and "rotate" the coordinate axes "by hand", or how should I interpret the output?

    Thank you for your help!

    TOTAL ELECTROSTATIC POTENTIAL


     3  POINT  COORDINATES      V0           V1(Z)        V1(X)        V1(Y)
    

    1 1.9790 2.3308 1.8870 -2.43511E+01 -1.44599E-04 -3.08862E-02 -2.33966E-02
    2 -7.8558 -3.2175 1.8921 -2.75956E+01 3.35688E-05 -1.79861E-03 -5.24897E-03
    3 -2.4880 0.9348 1.8905 -5.97785E+01 3.49451E-05 1.44597E-02 -8.08926E-03

    TRACELESS ELECTRIC FIELD GRADIENT TENSOR

    POINT 1 POSITION 1.9790 2.3308 1.8870

    TENSOR IN ORIGINAL CARTESIAN AXES
    XX -4.074007E-02 YY 1.062909E-02 ZZ 3.011098E-02 XY -3.411483E-02 XZ -7.494557E-05 YZ -2.045206E-04

    TENSOR IN PRINCIPAL AXES SYSTEM
    AA -5.775846E-02 BB 2.763815E-02 CC 3.012031E-02

    PRINCIPAL AXES
    X Y Z
    A 8.948364E-01 4.463906E-01 1.802221E-03
    B -4.456747E-01 8.931575E-01 6.036308E-02
    C 2.533584E-02 -5.481828E-02 9.981749E-01

    ANGLES BETWEEN PRINCIPAL AXES AND ORIGINAL AXES (DEGREES)
    X Y Z
    A 26.512576 63.487657 89.896740
    B 116.466512 26.727256 86.539347
    C 88.548208 93.142432 3.462197


    Okay, so then I need to sort the values manually according to convention. Thank you!
  • Aleksand75

    Hello, I'm trying to calculate the bulk modulus of elasticity for a solid. I'm entering the following part of text in a *d.12 file:
    ...
    EOS
    RANGE
    0.99 1.01 3
    PRANGE
    0 10 5
    END
    ....
    DFT
    PBE
    END
    TOLINTEG
    7 7 7 7 14
    TOLDEE
    9
    MAXCYCLE
    200
    SHRINK
    6 6
    FMIXING
    70
    PPAN

    The calculation results return an error:
    " ERROR **** SCF **** SG_IRR ALLOCATION ERROR: ALREADY ALLOCATED"

    Could you tell me what's wrong and what to do?
    Thank you.


    Thank you very much for your attention to this issue! I'm glad it's not my understanding that's wrong. I've already begun implementing your proposed approach.
  • yuliyaglushkova

    Hello, i I tried to calculate the molecular orbitals: "Crystalline Orbitals (COs) - Canonical Orbitals". I have the fort.9 file ready with the following .d3 file :
    NEWK
    8 8
    1 0
    ORBITALS
    Pd_Cu_Act
    1
    0
    END
    END
    After some time, in outfile an error appears:
    ERROR **** F90MAIN3 **** KEYWORD ORBITALS NOT ALLOWED
    Could you help which problem is this?


    Thank you!
  • zhuyt

    I want to build the carbon nanotube supercell with keyword “supercell ”, unfortunately, the crystal reports errors:“**** MULTIP **** SYMMOPS DO NOT FORM A GROUP ”
    the INPUT file:
    TEST07_1 - armchair C NANOTUBE - 6-21G, PBEsol
    SLAB
    77
    2.47
    1
    6 -0.33333333333 0.33333333333 0.
    SWCNT
    5 5
    supercell
    2
    end


    To generate a supercell of a nanotube, you should first build the supercell of the slab and then generate the nanotube (without applying the supercell). In this case, you should adjust (n,m) according to the desired diameter.
  • GiacomoAmbrogio

    The Department of Chemistry and the Thomas Young Centre at Imperial College London 🇬🇧 and the Theoretical Chemistry Group of the University of Torino 🇮🇹, in collaboration with the Computational Materials Science Group of the Science and Technology Facilities Council (STFC), are organising the

    logo0.png

    MSSC2026 Summer School on

    Ab initio Modelling in Solid State Chemistry

    The School is designed for Master and Ph.D. students, as well as for post-docs and researchers who have an interest in getting or strengthening a background in:

    • ⚛️ Computational Solid State Chemistry
    • 🧠 Physics
    • 🧱 Materials Science
    • 🌐 Surface- and Nano-Science

    📅 The week-long School consists of morning lectures and afternoon hands-on tutorial sessions, where the formal framework and functionalities of the CRYSTAL electronic structure package will be explored.

    📌 While we strongly encourage in-person participation, we also offer the possibility to attend remotely through streaming of morning lectures and afternoon hands-on tutorials.

    📝 Participants will have the opportunity to present their research at a poster session.

    👉 You can register here!
    Friday 8 May - Deadline for payment of early bird fees.

    See the School website for further details.


  • job314

    Dear all, what is the purpose of the phonon dispersion calculations according to the tutorial? What is the effect we are seeing, going beyond the gamma point?

    https://tutorials.crystalsolutions.eu/tutorial.html?td=thermo&tf=thermo2#phonon

    More importantly, how do I set it up properly? What size SCELPHONO should I be after? Is the point to have all of my crystals about the same atoms in the generated SCELPHONO for appropriate comparison? I was perusing the tutorial but I could not quite understand the purpose or the correct setup of SCELPHONO

    thank you

    Jonas


    Yes Aleks that's what I meant. But I see now convergence with k points thank you
  • job314

    I am used to seeing 3 zero frequency modes in the crystal frequency calculation output. This urea crystal calculation has only two - I was wondering why and can I use this outcome for thermodynamics calculations with this missing mode

    MODES         EIGV          FREQUENCIES     IRREP  IR   INTENS    RAMAN
                 (HARTREE**2)   (CM**-1)     (THZ)             (KM/MOL)
        1-   2   -0.1181E-19      0.0000    0.0000  (E  )   A (     0.00)   A
        3-   3    0.2094E-19      0.0000    0.0000  (B2 )   A (     0.00)   A
        4-   4    0.1254E-06     77.7189    2.3300  (B1 )   I (     0.00)   A
        5-   5    0.2460E-06    108.8462    3.2631  (A2 )   I (     0.00)   I
        6-   7    0.3349E-06    127.0111    3.8077  (E  )   A (     0.00)   A
        8-   8    0.4355E-06    144.8406    4.3422  (A1 )   I (     0.00)   A
        9-  10    0.6407E-06    175.6769    5.2667  (E  )   A (     0.00)   A
       11-  12    0.1108E-05    230.9837    6.9247  (E  )   A (     0.00)   A
       13-  13    0.4844E-05    483.0526   14.4816  (B1 )   I (     0.00)   A
       14-  14    0.6693E-05    567.8172   17.0227  (A1 )   I (     0.00)   A
       15-  16    0.6926E-05    577.5886   17.3157  (E  )   A (     0.00)   A
       17-  17    0.7310E-05    593.3990   17.7897  (B2 )   A (     0.00)   A
       18-  19    0.7970E-05    619.6054   18.5753  (E  )   A (     0.00)   A
       20-  20    0.8638E-05    645.0548   19.3383  (A2 )   I (     0.00)   I
       21-  21    0.1067E-04    717.0169   21.4956  (B1 )   I (     0.00)   A
       22-  22    0.1286E-04    787.0371   23.5948  (A2 )   I (     0.00)   I
       23-  24    0.1322E-04    798.0946   23.9263  (E  )   A (     0.00)   A
       25-  26    0.1420E-04    826.9504   24.7914  (E  )   A (     0.00)   A
       27-  27    0.2232E-04   1036.9495   31.0870  (B2 )   A (     0.00)   A
       28-  28    0.2251E-04   1041.3084   31.2176  (A1 )   I (     0.00)   A
       29-  30    0.2535E-04   1105.1276   33.1309  (E  )   A (     0.00)   A
       31-  31    0.2780E-04   1157.1639   34.6909  (B2 )   A (     0.00)   A
       32-  32    0.3003E-04   1202.7304   36.0569  (A1 )   I (     0.00)   A
       33-  34    0.4803E-04   1521.0625   45.6003  (E  )   A (     0.00)   A
       35-  35    0.4892E-04   1535.0190   46.0187  (A1 )   I (     0.00)   A
       36-  36    0.5334E-04   1602.8976   48.0537  (B2 )   A (     0.00)   A
       37-  38    0.5717E-04   1659.4784   49.7499  (E  )   A (     0.00)   A
       39-  39    0.5840E-04   1677.2645   50.2831  (A1 )   I (     0.00)   A
       40-  40    0.6098E-04   1713.8726   51.3806  (B2 )   A (     0.00)   A
       41-  42    0.2380E-03   3386.0936  101.5125  (E  )   A (     0.00)   A
       43-  43    0.2424E-03   3416.7391  102.4313  (A1 )   I (     0.00)   A
       44-  44    0.2438E-03   3426.7219  102.7305  (B2 )   A (     0.00)   A
       45-  46    0.2612E-03   3547.0252  106.3371  (E  )   A (     0.00)   A
       47-  47    0.2614E-03   3548.4246  106.3791  (A1 )   I (     0.00)   A
       48-  48    0.2657E-03   3577.3918  107.2475  (B2 )   A (     0.00)   A
    

    urea.out


    I see, thank you
  • Chhatra

    Dear Crystal Users and Developers,

    I am currently studying the electronic properties of a 2D Janus monolayer, using CRYSTAL17. I am interested in visualizing the spatial localization of the Valence Band Maximum (VBM) and Conduction Band Minimum (CBM) to confirm charge separation across the Janus surfaces.
    My system is a semiconductor with a direct band gap at the
    K point. I would like to generate 3D electron density maps (isosurfaces) for these specific bands only.

    Any guidance or example .d3 inputs for band-specific density plotting would be greatly appreciated.
    Thank you for your time and help.

    Best regards,
    Chhatra Subba


    Thank you so much!
  • Jia-Lin Chang

    Hi,
    I am a CRYSTAL23 user. I performed the computation of Raman intensities of some crystals. I wonder how to get the values of the Raman tensor? I read a copy of the TENS_RAMAN.DAT file, but I don't known how these data are defined. I assume that each row corresponds to a phonon mode and the columns are subsequently the xx, xy, xz, yy, yz, and zz componesnts of the Raman tensor, am I right? I found that the computed polarized Raman intensities are consistent with the space group of the crystal, but the Raman tensors are not, given the tensors are all non-zero. Can you please tell me how to get the data of Raman tensor from the output and tell me the unit of the Raman tensor CRYSTL23 used? Thanks a lot!


    ​Dear Prof. Erba, Thank you for your clear explanation.
  • CaesarSalad

    Hello.

    Is there a way in CRYSTAL23 to output the full Kohn–Sham potential of the periodic cell? Or alternatively each component separately (nuclear potential + hartree + XC potential) Ideally in a periodic cell, maybe exported as a cube or grid file?

    Thanks in advance,

    Chris


    Hi, With CRYSTAL (from the PROPERTIES module actually) one can output the Hartree+EN potential in the all-electron case in 2D or 3D grids with POTM and POT3 keywords, respectively. In the latter case, the output is in .cube format. But I am afraid that currently there is no keyword to plot the XC part of the potential on a grid.
  • CaesarSalad

    Hi. Not sure where to ask this, but in the SCFOUT.log file there is a section at the end titled "TOTAL ATOMIC SPINS " and it shows the spin on each ionic site; I'm curious if these are in units of the Bohr magneton by any chance? And how are they calculated inside Crystal (roughly)? Thanks, Chris.


    Hi Alessandro, thanks for the info! Much appreciated, Chris.
  • GiacomoAmbrogio

    Dear CRYSTAL community,

    The CRYSTAL Team is heading to Brazil! 🇧🇷✨
    Next week (26th Jan – 29th Jan 2026), we will be in Volta Redonda (Rio de Janeiro state) for the

    logo.jpeg

    QMMC 2026 will be hosted at the Universidade Federal Fluminense and it will be an exciting journey through quantum modelling of materials, covering a wide range of topics in computational chemistry and condensed matter physics.

    We are truly excited to be in Volta Redonda and to share knowledge, experience, and, of course, to spread the CRYSTAL verb!

    More information about the school can be found on the event website.

    See you in Brazil!


    It was a great week! Let me share a group picture from the event: [image: QMMC2026_Volta_Redonda.jpeg]
  • Drmajouri2025

    I am performing Raman frequency calculations in CRYSTAL for a (26,0) carbon nanotube. The geometry and SCF dont converge correctly, and the vibrational calculation runs without crashing.

    However, in the output I obtain:
    SUM TENSOR OF THE VIBRATIONAL CONTRIBUTIONS TO THE STATIC POLARIZABILITY TENSOR

    ******************* -0.00000 0.00000
    -0.00000 2575.62713 0.00000
    0.00000 0.00000 2575.62713

    What does the “***********” mean in this context ?
    Or this is due of the not completed optimization ?


    Thank you, this is too clear and very helpful.
  • QMQDCHEM

    b51cde88-0bb3-4dd8-a7fc-29f23ae36e25-изображение.png

    import CRYSTALClear.plot as CCplt
    import matplotlib.pyplot as plt
    from pathlib import Path
    
    band_files = list(Path('.').rglob('BAND.DAT'))
    
    bands = []
    
    for index, band_file in enumerate(band_files):
        print(f'Processing: {band_file}')
        band = Properties_output().read_electron_band(str(band_file))
        bands.append(band)
        
        CCplt.plot_electron_band(
            band, 
            energy_range=[-0.7, 16], 
            linewidth=1.5, 
            figsize=(8,6), 
            k_labels=['Gamma','W','X','L','Gamma']
        )
        plt.show()
    
    
    CCplt.plot_electron_band(
        bands, 
        energy_range=[-1, 16], 
        linewidth=1.5, 
        figsize=(9,7), 
        k_labels=['Gamma','W','X','L','Gamma']
    )
    plt.show()
    
    END_OF_PYTHON
    

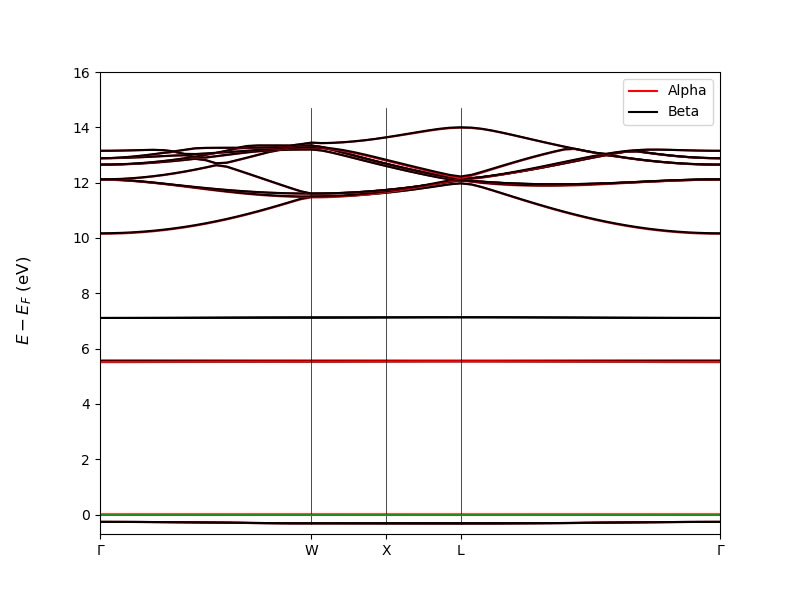
    I cannot change the height of the lines marking the k-points on the band structure diagram.
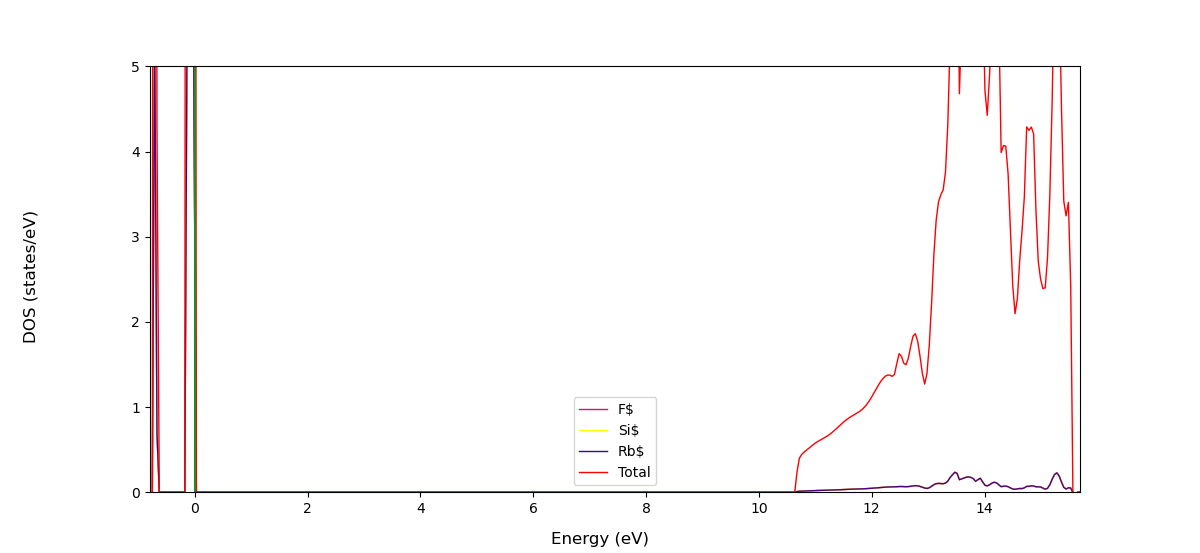
    Figure_1.png

    #!/bin/bash
    
    source /home/noctua-v2/miniconda3/bin/activate crystal
    exec python - "$@" <<'END_OF_PYTHON'
    
    from CRYSTALClear.crystal_io import Properties_output
    import CRYSTALClear.plot as CCplt
    import matplotlib.pyplot as plt
    
    
    # DOSS.DAT path declaration
    doss = 'DOSS.DAT'
    
    # Crystal Object generation
    doss = Properties_output().read_electron_dos(doss)
    
    # Plot generation
    CCplt.plot_electron_dos(doss, overlap=True, color=['mediumvioletred', 'yellow', 'indigo', 'red'], labels=['F$', 'Si$','Rb$', 'Total'], dos_range=[0,10])
    
    plt.show()
    

    I cannot change the y-axis grid on the DOS plot.


    Hi @QMQDCHEM , Could you share your BAND.DAT file so that I can do some quick test? Thanks
  • QMQDCHEM
    (base) noctua-v2@noctua-v2-X9DR3-F:~/Desktop/RSF/band$ ls
     BAND.DAT  'BAND STRUCTURE.jpeg'   fort.25   fort.87   fort.9   INPUT   OUTPUT
    

    Can I use BAND.DAT as *.BAND and OUTPUT as *.out files in code?

    from CRYSTALpytools.electronics import ElectronBand
    from pymatgen.electronic_structure.plotter import BSPlotter
    
    band = ElectronBand.from_file('*.DAT', 'OUTPUT')
    pmgband = mgoband.to_pmg(labels=[r'$\Gamma$', 'W', 'X', 'L', r'$\Gamma$'])
    bsplot = BSPlotter(pmgband)
    bsplot.get_plot(ylim=(-10, 10), zero_to_efermi=True)
    

    Thank you! This is much more comfortable.
  • Alexander

    CsSrI3_Pm3m_BASISINPUT.out CsSrI3_Pm3m_BASISLIBRARY.out

    I encountered an error with basis set library. Pseudopotential from internal library for iodine contains one extra line:
    P4 TMS 0.0000000 0.0000000 0 0.0000000 0.0000000 0
    which probably makes geometry optimization fail.

    Maybe there is a way to fix or somehow modify internal basis set library? Really would like to keep my inputs short.


    Dear Alexander, We runned a few tests, and, indeed, we found the same behavior. This, though, is not due to an error in the definition in the basis set, but rather to some formatting issue, since the Cs goes up to P4 the code expects that also the Iodine pseudo goes up to P4 and fills the missing coefficients and exponents with zeros. Luckily there is an easy workaround to this, it is sufficient to flip Cs and I definition in the geometry and the results are the same as the one you obtained by defining the basis set in the input as you can see from my test. I will leave you here two output snippets hoping that they help clarifying the issue: Cs defined before I in the geometry section INPUT COORDINATES ATOM AT. N. COORDINATES 1 38 5.000000000000E-01 5.000000000000E-01 5.000000000000E-01 2 55 0.000000000000E+00 0.000000000000E+00 0.000000000000E+00 3 53 0.000000000000E+00 5.000000000000E-01 5.000000000000E-01 ******************************************************************************* *** PSEUDOPOTENTIAL INFORMATION *** ******************************************************************************* ATOMIC NUMBER 38, NUCLEAR CHARGE 10.000, PSEUDOPOTENTIAL TYPE EXPONENT COEFF. N EXPONENT COEFF. N P0 TMS 6.9334610 135.2710429 0 4.1140038 17.9440714 0 P1 TMS 7.2168166 29.4380813 0 7.1736962 58.8806749 0 3.0227988 4.9362827 0 2.8656990 9.7233521 0 P2 TMS 6.3215146 11.9072392 0 6.3914995 17.8595514 0 1.7697266 2.1991802 0 1.6367717 2.8935709 0 P3 TMS 4.2441984 -5.5093333 0 4.2291645 -7.3046417 0 ATOMIC NUMBER 55, NUCLEAR CHARGE 9.000, PSEUDOPOTENTIAL TYPE EXPONENT COEFF. N EXPONENT COEFF. N P0 TMS 4.0811192 84.5477223 0 2.4215224 16.6540350 0 P1 TMS 5.5339726 52.3496307 0 5.5067944 104.6994132 0 2.2809616 8.8065577 0 2.1034905 17.6166111 0 P2 TMS 1.8131494 5.2689855 0 1.8077217 7.9036419 0 0.8729040 1.3364313 0 0.8587203 2.0056513 0 P3 TMS 5.2170839 -16.4976543 0 5.1481965 -23.3081313 0 1.5805995 -2.2368273 0 1.3478959 -2.2269420 0 P4 TMS 1.8077398 -2.5041987 0 1.8050613 -3.1382445 0 ATOMIC NUMBER 53, NUCLEAR CHARGE 25.000, PSEUDOPOTENTIAL TYPE EXPONENT COEFF. N EXPONENT COEFF. N P0 TMS 40.0333760 49.9896490 0 17.3005760 281.0065560 0 8.8517200 61.4167390 0 P1 TMS 15.7201410 67.4162390 0 15.2082220 134.8076960 0 8.2941860 14.5665480 0 7.7539490 28.9684220 0 P2 TMS 13.8177510 35.5387560 0 13.5878050 53.3397590 0 6.9476300 9.7164660 0 6.9600990 14.9775000 0 P3 TMS 18.5229500 -20.1766180 0 18.2510350 -26.0880770 0 7.5579010 -0.2204340 0 7.5974040 -0.2216460 0 P4 TMS 0.0000000 0.0000000 0 0.0000000 0.0000000 0 I defined before Cs in the geometry section INPUT COORDINATES ATOM AT. N. COORDINATES 1 38 5.000000000000E-01 5.000000000000E-01 5.000000000000E-01 2 53 0.000000000000E+00 5.000000000000E-01 5.000000000000E-01 3 55 0.000000000000E+00 0.000000000000E+00 0.000000000000E+00 [...] ******************************************************************************* *** PSEUDOPOTENTIAL INFORMATION *** ******************************************************************************* ATOMIC NUMBER 38, NUCLEAR CHARGE 10.000, PSEUDOPOTENTIAL TYPE EXPONENT COEFF. N EXPONENT COEFF. N P0 TMS 6.9334610 135.2710429 0 4.1140038 17.9440714 0 P1 TMS 7.2168166 29.4380813 0 7.1736962 58.8806749 0 3.0227988 4.9362827 0 2.8656990 9.7233521 0 P2 TMS 6.3215146 11.9072392 0 6.3914995 17.8595514 0 1.7697266 2.1991802 0 1.6367717 2.8935709 0 P3 TMS 4.2441984 -5.5093333 0 4.2291645 -7.3046417 0 ATOMIC NUMBER 53, NUCLEAR CHARGE 25.000, PSEUDOPOTENTIAL TYPE EXPONENT COEFF. N EXPONENT COEFF. N P0 TMS 40.0333760 49.9896490 0 17.3005760 281.0065560 0 8.8517200 61.4167390 0 P1 TMS 15.7201410 67.4162390 0 15.2082220 134.8076960 0 8.2941860 14.5665480 0 7.7539490 28.9684220 0 P2 TMS 13.8177510 35.5387560 0 13.5878050 53.3397590 0 6.9476300 9.7164660 0 6.9600990 14.9775000 0 P3 TMS 18.5229500 -20.1766180 0 18.2510350 -26.0880770 0 7.5579010 -0.2204340 0 7.5974040 -0.2216460 0 ATOMIC NUMBER 55, NUCLEAR CHARGE 9.000, PSEUDOPOTENTIAL TYPE EXPONENT COEFF. N EXPONENT COEFF. N P0 TMS 4.0811192 84.5477223 0 2.4215224 16.6540350 0 P1 TMS 5.5339726 52.3496307 0 5.5067944 104.6994132 0 2.2809616 8.8065577 0 2.1034905 17.6166111 0 P2 TMS 1.8131494 5.2689855 0 1.8077217 7.9036419 0 0.8729040 1.3364313 0 0.8587203 2.0056513 0 P3 TMS 5.2170839 -16.4976543 0 5.1481965 -23.3081313 0 1.5805995 -2.2368273 0 1.3478959 -2.2269420 0 P4 TMS 1.8077398 -2.5041987 0 1.8050613 -3.1382445 0 I hope this helps
  • andrejsc

    Here is an old input that caused malloc on two different computer systems (I think one of these was Cineca, but that one was run for me by my colleague). I do not need the result of this calculation anymore, but I was told to share it during Crystal school this autumn.
    malloc.d3
    sb_wyckoff_tzvp.f9


    Hi, We have run some tests and we have identified the origin of the problem. The calculation fails in the evaluation of the Fermi energy in the NEWK option (so before getting to the BOLTZTRA step) because of large memory requirements due to a very large number of k-points being asked and because of the replicated-memory parallel implementation of that bit of code. In that part of the code, with Pproperties (parallel version), data are replicated in memory by each process. We have run tests on this system in parallel with different number of processes (on a computing node with 128 CPU cores) and for different shrinking factor parameters of the NEWK keyword. Results are summarized in the table below: [image: analysis.png] "ok" marks combinations for which the calculation run without errors. The trend is clear and can be rationalized as follows: reducing the number of k points reduces memory requirments reducing the number of MPI processes effectively increases the available memory/process Hope this clarifies things and helps find a way forward,
  • DLP

    Hi,

    I would like to obtain the irreducible representations of the eigenstates for a given crystal at each k-point. To do so, I am running properties with the following .d3 file:

    NEWK
    0 0
    0 2
    66 1
    67 1
    END

    The output file (.outp) gives me the eigenvalues at each k-point with a label, for instance A'',A',E'',etc. In that same .outp file there is a list of character tables, which I assume that each character table corresponds to a k-point in order of appearance. However, the irreps that appear in the n-th character table do not correspond to the irreps that appear in the n-th set of eigenvalues, meaning that you can have an irrep labelled B3 in the eigenvalues but for the corresponding character table there is no B3 irrep. How can I identify what the irreps of the eigenstates actually are or how they transform under the symmetry operations of the little point group ?


    Hi, I used space group 186 for ZnO that corresponds to the one you mention. In the character table printed by CRYSTAL only those irreps that are actually used to build symmetry-adapted Bloch functions are shown. I have updated my original post above to show the irrep labels in the character tables, which match those found in the printing of the eigenvalues. Hope this clarifies things,